Model Reliability
The confidence of the models’ capacity to simulate the changing climate includes several steps:
- Comparing observed and simulated past climate variability (i.e. quantification of model uncertainties) and analyzing causes of observed variations
- Performing multi-model reconstructions of past climate and by various future greenhouse gas emission and air- and riverborne nutrient load scenarios
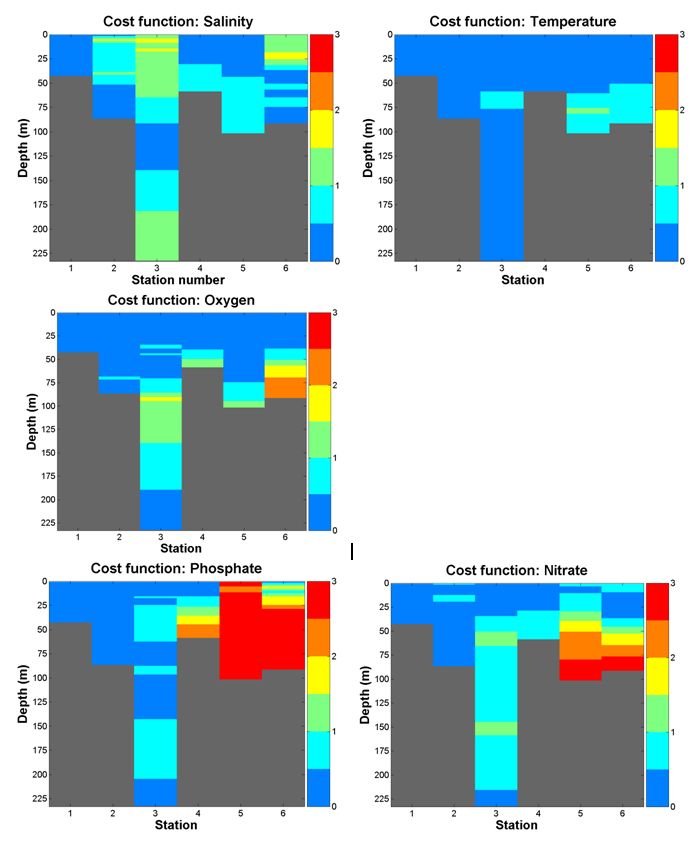
Cost functions
Shown below are vertical profiles of cost-function values for the ensemble averages (1970-2005) of salinity, temperature, oxygen, phosphate, nitrate at 6 stations (Anholt E, BY5, BY15, LL07, SR5, see map) ranging from the Kattegat in the west to the Bothnian Bay in the north. Light and dark blue colors (0-1) indicate good results, green and yellow colors indicate reasonable (1-2), while orange and red colors indicate poor results (>2).
The cost function is a quick tool to assess the quality of model results compared to data and they give good indications to where more efforts are needed.
 The ECOSUPPORT Decision Support System (DSS) web pages: