 |
Advanced tool for scenarios of the Baltic Sea ECOsystem to SUPPORT decision making
|
DECISION SUPPORT SYSTEM (DSS)
Hindcasts
Long-term hindcast simulations with the coupled biogeochemical-physical ocean models have been used to validate simulated processes and the sensitivity to changes in the forcing.
Shown below are observations and model results of vertical profiles and seasonal cycles of major oceanographic and biogeochemical variables. The results show that the models are capable of reproducing observed variability of physical and biogeochemical data to a good degree.
 Click on the links below to see the results: Click on the links below to see the results:
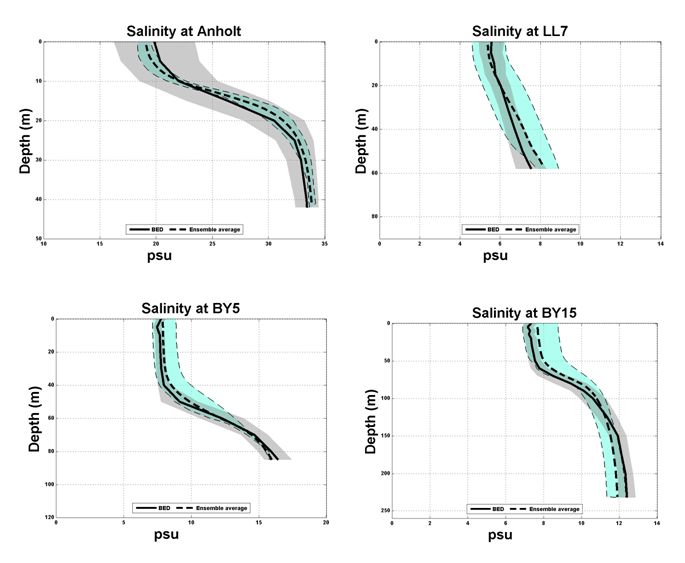
Salinity: Vertical profiles
Average (1970-2005) salinity (psu) at Anholt E, BY5, BY15 and LL07. The black solid line and the grey shaded area indicate the mean value and ±1 standard deviation of BED data (observations).
The black dashed line and the blue shaded area indicate the mean spread of the model ensemble.
 Back to top Back to top
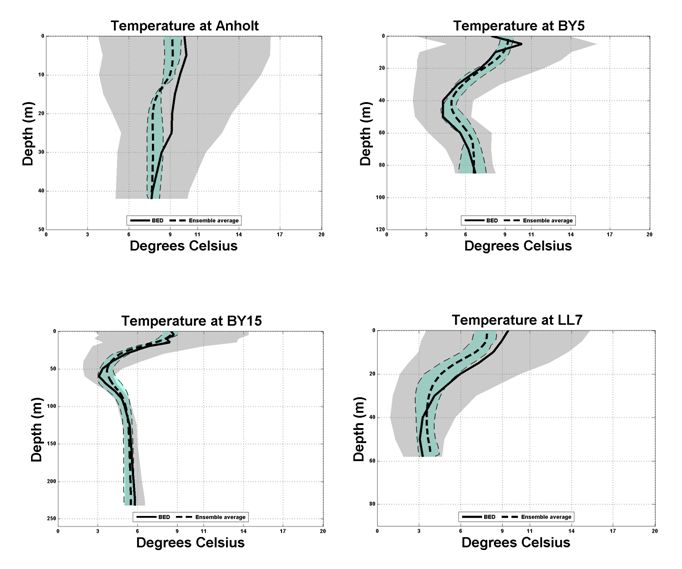
Temperature: Vertical profiles
Average (1970-2005) temperatures (°C) at Anholt E, BY5, BY15 and LL07. The black solid line and the grey shaded area indicate the mean value and ±1 standard deviation of BED data (observations).
The black dashed line and the blue shaded area indicate the mean and spread of the model ensemble.
 Back to top Back to top
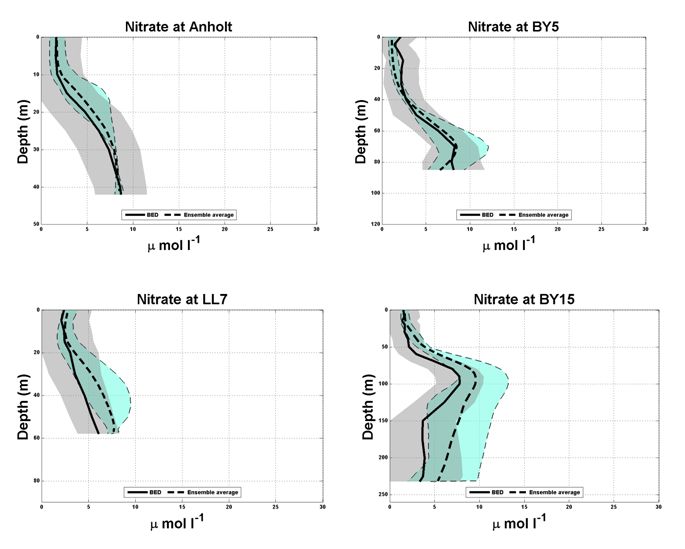
Nitrate: Vertical profiles
Average (1970-2005) nitrate (µmolNl-1) concentrations at Anholt E, BY5, BY15 and LL07. The black solid line and the grey shaded area indicate the mean value and ±1 standard deviation of BED data (observations). The black dashed line and the blue shaded area indicate the mean and spread of the model ensemble.
 Back to top Back to top
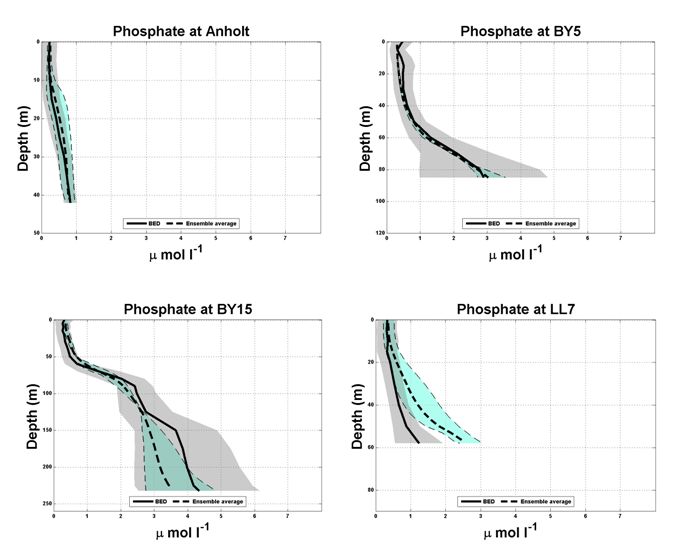
Phosphate: Vertical profiles
Average (1970-2005) phosphate (µmolPl-1) concentrations at Anholt E, BY5, BY15 and LL07. The black solid line and the grey shaded area indicate the mean value and ±1 standard deviation of BED data (observations). The black dashed line and the blue shaded area indicate the mean and spread of the model ensemble.
 Back to top Back to top
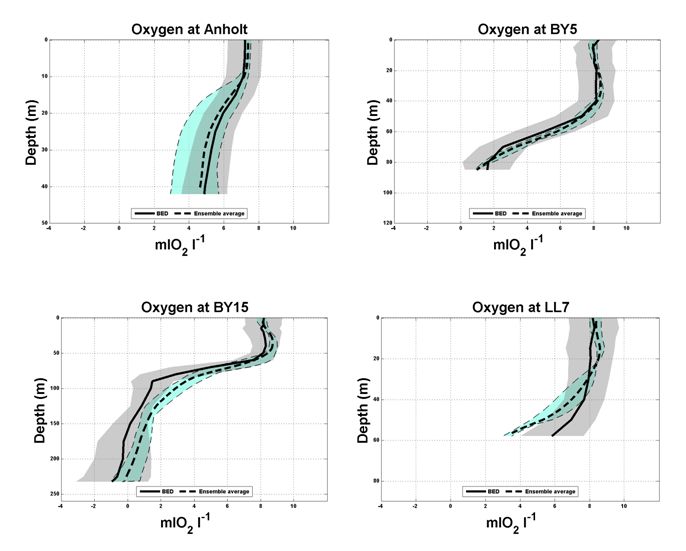
Oxygen: Vertical profiles
Average (1970-2005) oxygen (ml O2 l-1) concentrations at Anholt E, BY5, BY15 and LL07. The black solid line and the grey shaded area indicate the mean value and ±1 standard deviation of BED data (observations). The black dashed line and the blue shaded area indicate the mean and spread of the model ensemble.
 Back to top Back to top
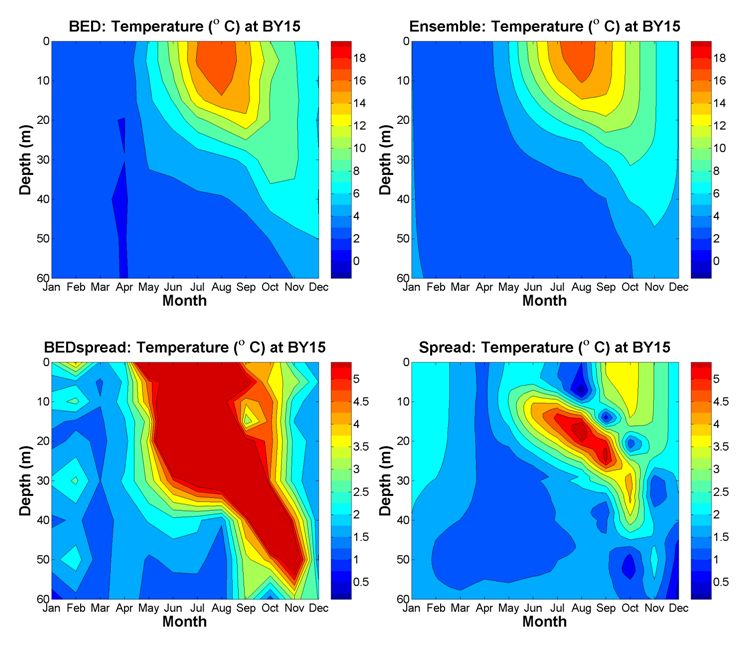
Temperature: Seasonal cycle
Annual cycle of monthly average (1970-2005) temperature (°C) at BY15 (upper panels). Results from BED (observations) and the ensemble average are shown in the left and right panels, respectively. The corresponding spread of BED data (BEDspread=2 x standard deviation) and the spread between models are shown in the lower panels, respectively.
 Back to top Back to top
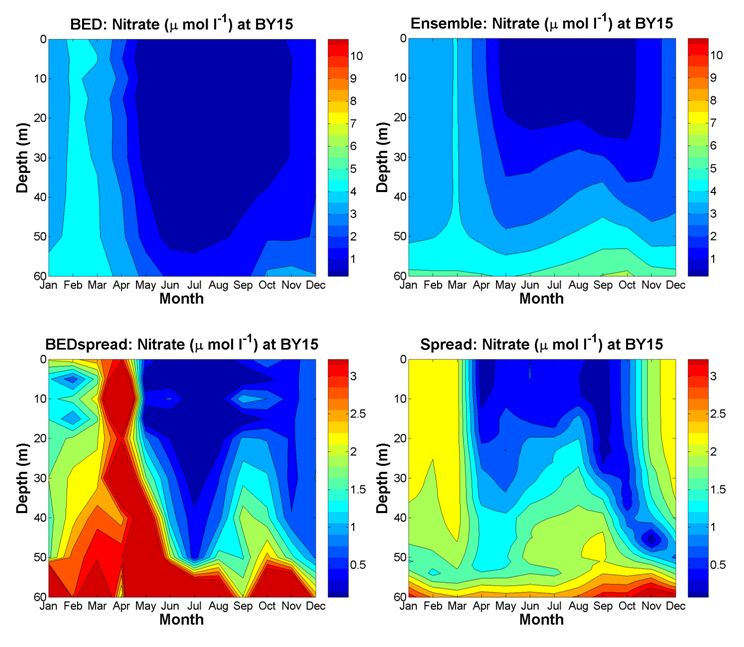
Nitrate: Seasonal cycle
Annual cycle of monthly average (1970-2005) nitrate (µmolNl-1) concentrations at BY15 (upper panels). Results from BED and the ensemble average are shown in the left and right panels, respectively. The corresponding spread of BED data (BEDspread=2 x standard deviation) and the spread between models are shown in the lower panels, respectively.
 Back to top Back to top
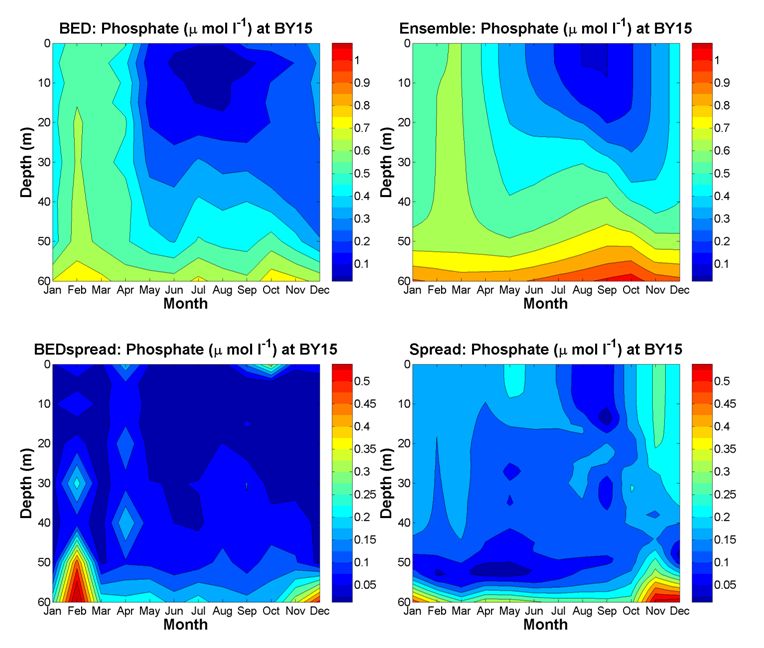
Phosphate: Seasonal cycle
Annual cycle of monthly average (1970-2005) phosphate (µmolPl-1) concentrations at BY15 (upper panels). Results from BED and the ensemble average are shown in the left and right panels, respectively. The corresponding spread of BED data (BEDspread=2 x standard deviation) and the spread between models are shown in the lower panels, respectively.
 Back to top Back to top
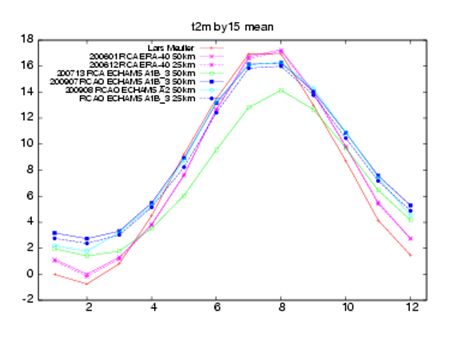
Air temperature
Monthly mean air temperature (in °C) at 2 meters height at the Gotland Deep station (BY15) in the central Baltic proper was simulated for the period 1980-2006: gridded observations (red, solid line with plus signs), RCA-ERA40 50km (pink, solid line with crosses), RCA-ERA40 25km (pink, dashed line with crosses), RCA-ECHAM5/A1B_3 50km (green, solid line with open squares), RCAO-ECHAM5/A1B_3 50km (blue, solid line with filled squares), RCAO-ECHAM5/A2 50km (light blue, solid line with open squares), and RCAO-ECHAM5/A1B_3 25km (blue, dashed line with open circles).
 Back to top Back to top
The mean seasonal cycle of air temperature is well simulated by the RCM when lateral boundary data from the two selected GCMs are used. The impact of the horizontal resolution of the model grid on the 2m air temperature is minor. In ECHAM5-driven simulations the 2m air temperature over the Baltic during summer is improved when the fully coupled RCAO model is used instead of the standalone atmospheric RCA model. In winter the climate of northern Europe is significantly controlled by the large-scale circulation and the added value of the coupled RCAO is minor.
|
 The ECOSUPPORT Decision Support System (DSS) web pages: